
Empowering Opioid & Mental Health Action Through Data
mHOPE visualizes and provides key data that can support decision-making and leads education on the intertwined opioid overdose and mental health epidemics
View methodology
Counties
Indicators
Federal Sources
Treatment Programs
Why mHOPE exists
The overdose and mental health crises are intertwined epidemics, so we map them together.
More than 60 million Americans live with mental illness, and opioid use disorder so often coincides with it that treating either in isolation misses the point. mHOPE brings mortality, mental health, treatment access, and social determinants of health into a single county-level view and provides easy access to the data.
The problem
The opioid overdose epidemic is one of the largest American public health epidemics of the 21st century. The United States is also experiencing a mental health crisis, with greater than 60 million Americans experiencing mental illness in 2024 (NAMI). Mental health and opioid use disorder often coincide with one another, as do difficulties accessing treatment for both conditions.
Our goal
Bring overdose, mental health, and travel-time-to-treatment data together from public sources into interactive maps and trends, including drive time to methadone treatment and local OTPs.
How to use it
Explore overdose, mental health, and treatment access through the Maps and Trends tools. Every view is interactive, spans multiple years, and responds to hover, click, and zoom.
What makes it different
It synthesizes many sources into one county-level picture other dashboards don't show — and it's transparent about data processing and provenance, with export available throughout.
Explore the tools
Maps and Trends
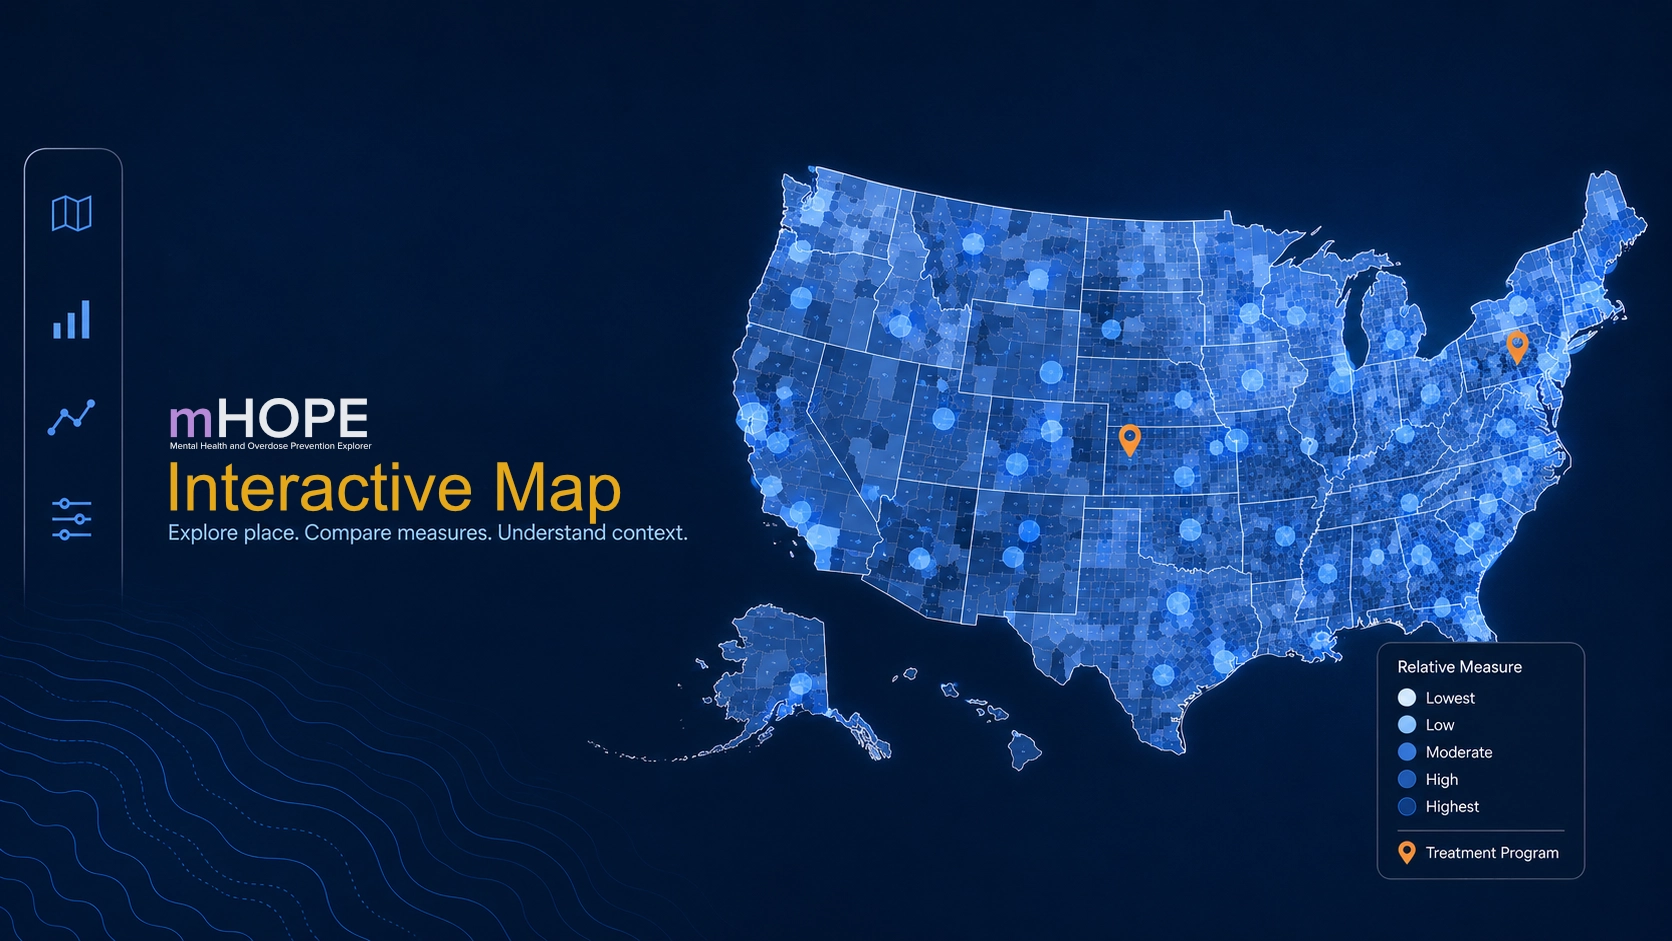
Interactive Maps
Our interactive maps bring together county-level data from the CDC, NVSS, NCHS, ACS, and BRFSS. Explore treatment access nationwide, including estimated drive times to methadone services and all SAMHSA-registered opioid treatment programs as of February 2026.
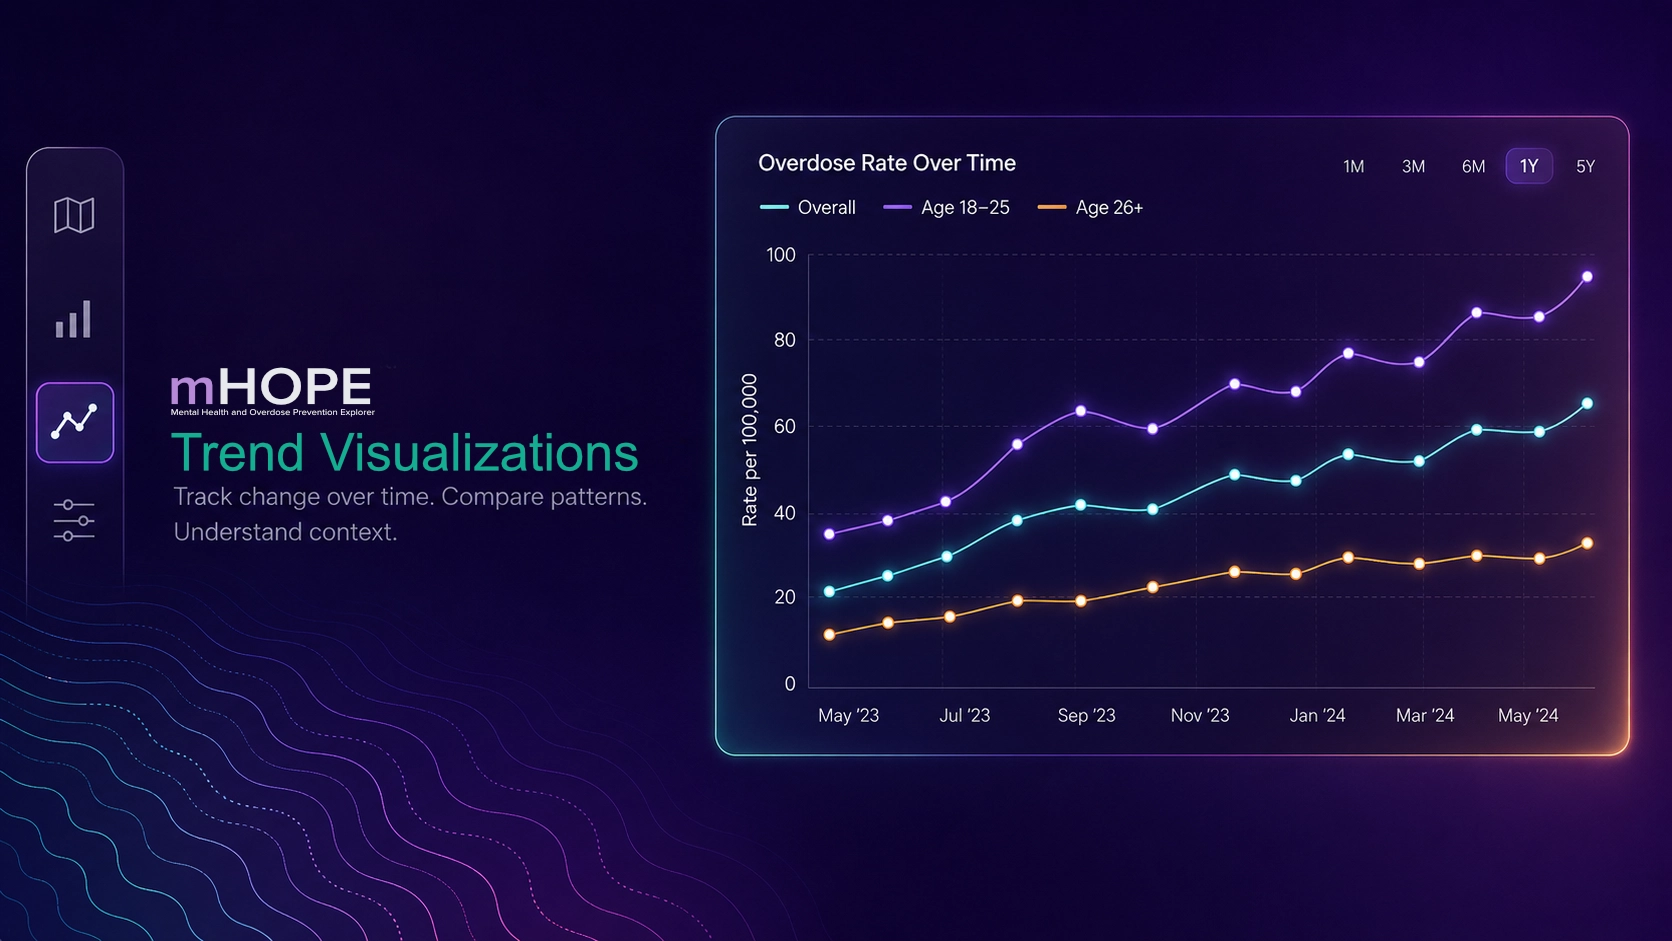
Trend visualisations
Track overdose deaths and rates across county, state, and national levels. Compare trends by sex and race or ethnicity, and explore travel times to treatment services using data from the CDC and National Vital Statistics System.
Full processing steps, suppression rules, and year coverage for every indicator are documented on the Data and Methodology page.